อันดับกองทุนไทยตาม MomentumThai Funds Ranked by Momentum
จัดอันดับกองทุนไทยที่ยังซื้อขายอยู่ ด้วยผลตอบแทนส่วนเกินเทียบดัชนี SET ย้อนหลัง 3/6/12 เดือน (สูตรคล้าย RS Rating ของหุ้น แต่ใช้กับกองทุน) — …Currently-trading Thai funds ranked by excess return vs the SET benchmark over trailing 3/6/12 months (a stock-style RS formula applied to funds) — …
ค่าธรรมเนียม 2% ต่อปี ฟังดูน้อย — แต่มันกิน "กำไร" ของคุณไปเท่าไหร่?A 2% Fund Fee Sounds Tiny — But How Much of Your GAIN Does It Actually Eat?
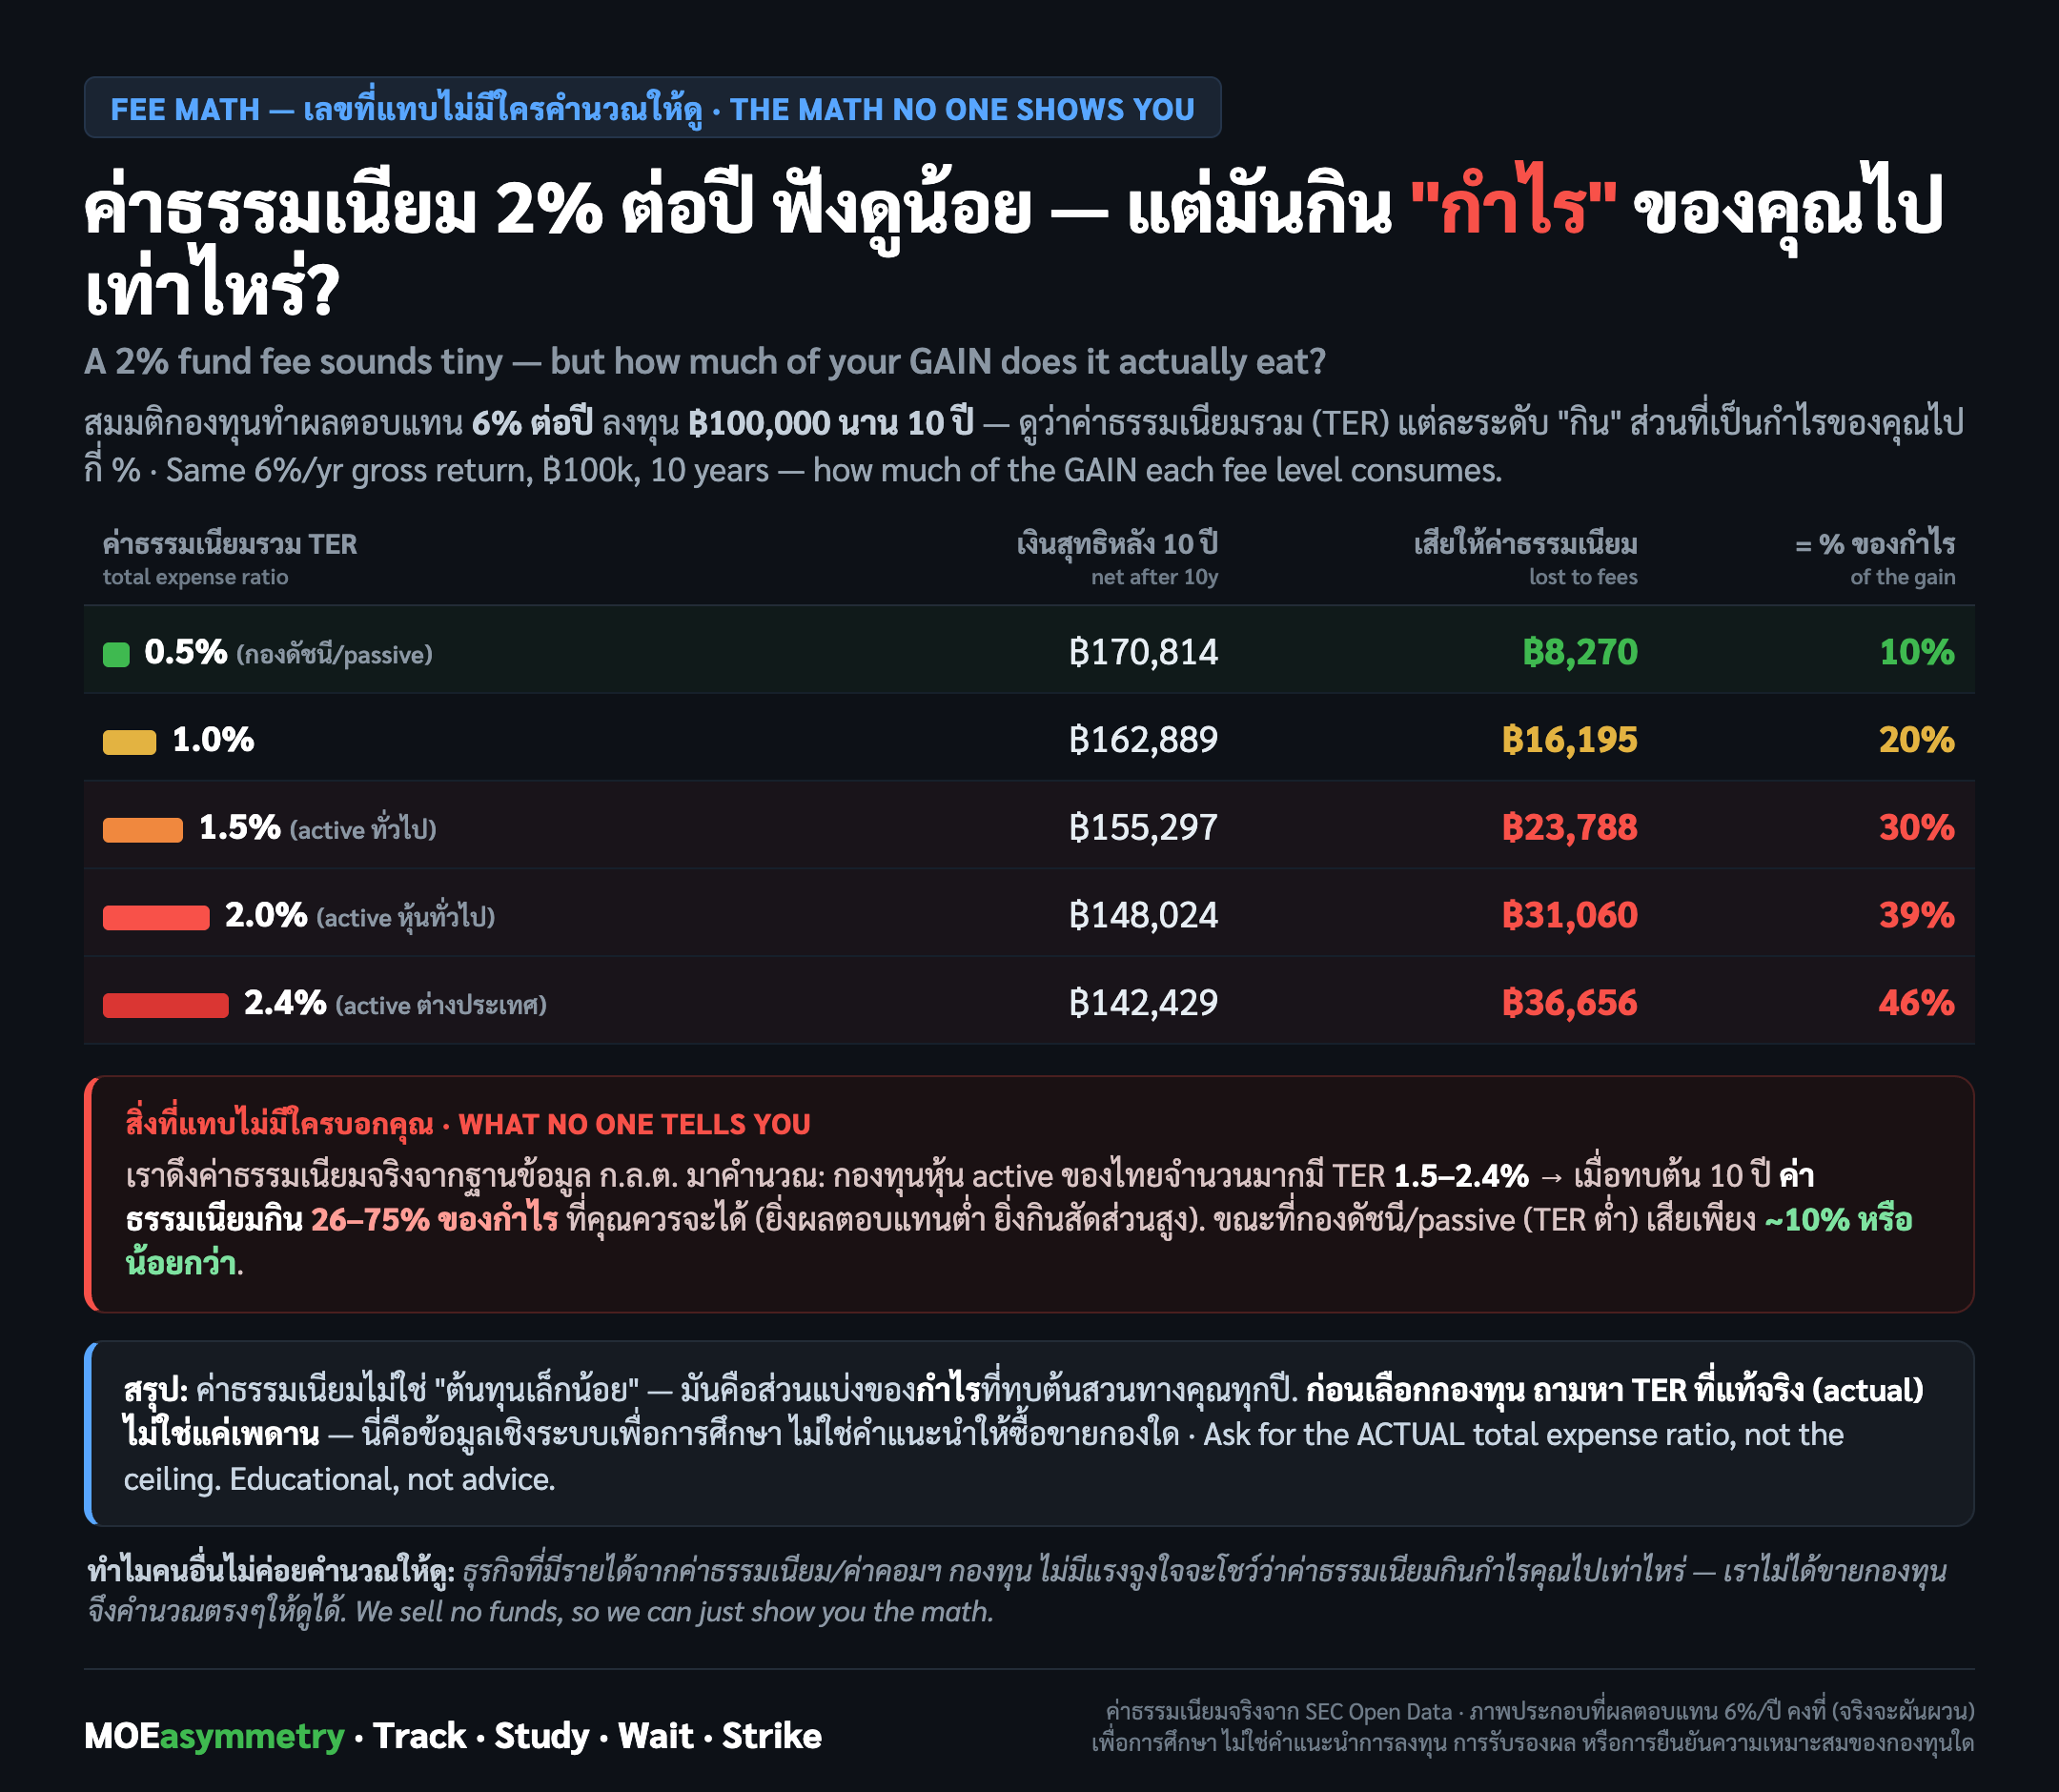
สมมติกองทุนทำผลตอบแทน 6% ต่อปี (ก่อนหักค่าธรรมเนียม) ลงทุน ฿100,000 นาน 10 ปี — ดูว่าค่าธรรมเนียมรวม (TER) แต่ละระดับ "กิน" ส่วนที่เป็นกำไรไปกี่%Assume 6%/yr gross return, ฿100,000, 10 years — see how much of the GAIN each total-expense-ratio (TER) level consumes
| ค่าธรรมเนียมรวม (TER)Total Expense Ratio | เงินสุทธิหลัง 10 ปีNet after 10y | เสียให้ค่าธรรมเนียมLost to fees | % ของกำไรof the gain |
|---|---|---|---|
| 0.5% (กองดัชนี/passive)(index/passive) | ฿170,814 | ฿8,270 | 10% |
| 1.0% | ฿162,889 | ฿16,195 | 20% |
| 1.5% (active ทั่วไป)(typical active) | ฿155,297 | ฿23,788 | 30% |
| 2.0% (active หุ้นทั่วไป)(typical active equity) | ฿148,024 | ฿31,060 | 39% |
| 2.4% (active ต่างประเทศ)(active, foreign mandate) | ฿142,429 | ฿36,656 | 46% |
เราดึงค่าธรรมเนียมจริงจากฐานข้อมูล ก.ล.ต. (SEC Open Data) มาคำนวณ: กองทุนหุ้น active ของไทยจำนวนมากมี TER 1.5–2.4% เมื่อทบต้น 10 ปี ค่าธรรมเนียมกิน 26–75% ของกำไรที่ควรจะได้ (ยิ่งผลตอบแทนต่ำ ยิ่งกินสัดส่วนสูง) ขณะที่กองดัชนี/passive (TER ต่ำ) เสียเพียง ~10% หรือน้อยกว่า We pulled actual fees from the SEC regulator database (SEC Open Data): many Thai active equity funds run TER 1.5–2.4%. Compounded over 10 years, fees eat 26–75% of the gain you'd otherwise keep (the lower the gross return, the higher that % climbs) — while low-TER index/passive funds lose only ~10% or less.
ตัวเลขค่าธรรมเนียมจริงจาก SEC Open Data · ภาพประกอบที่ผลตอบแทนคงที่ 6%/ปี (จริงจะผันผวน) เพื่อการศึกษา ไม่ใช่คำแนะนำการลงทุน ไม่ใช่การรับรองผลตอบแทน ไม่ใช่การยืนยันความเหมาะสมของกองทุนใด — ไม่ใช่การพาดพิงกองทุนใดกองทุนหนึ่งเป็นการเฉพาะReal fee figures via SEC Open Data · illustration assumes a constant 6%/yr gross return (real returns vary) — educational only, not a performance guarantee, not a suitability confirmation, not a claim about any specific named fund.
"สิ่งที่แทบไม่มีใครบอกคุณ" — งานวิจัยตรงไปตรงมา"What No One Tells You" — the Honest Research Log
เราทดสอบสมมติฐานของตัวเองแบบเดียวกับที่ทดสอบระบบหุ้น — รวมถึงรายงานตอนที่ผลลบล้างสมมติฐาน (falsification) เหมือนกันWe test our own fund hypotheses with the same rigor as our stock system — and publish it even when the result falsifies the headline.
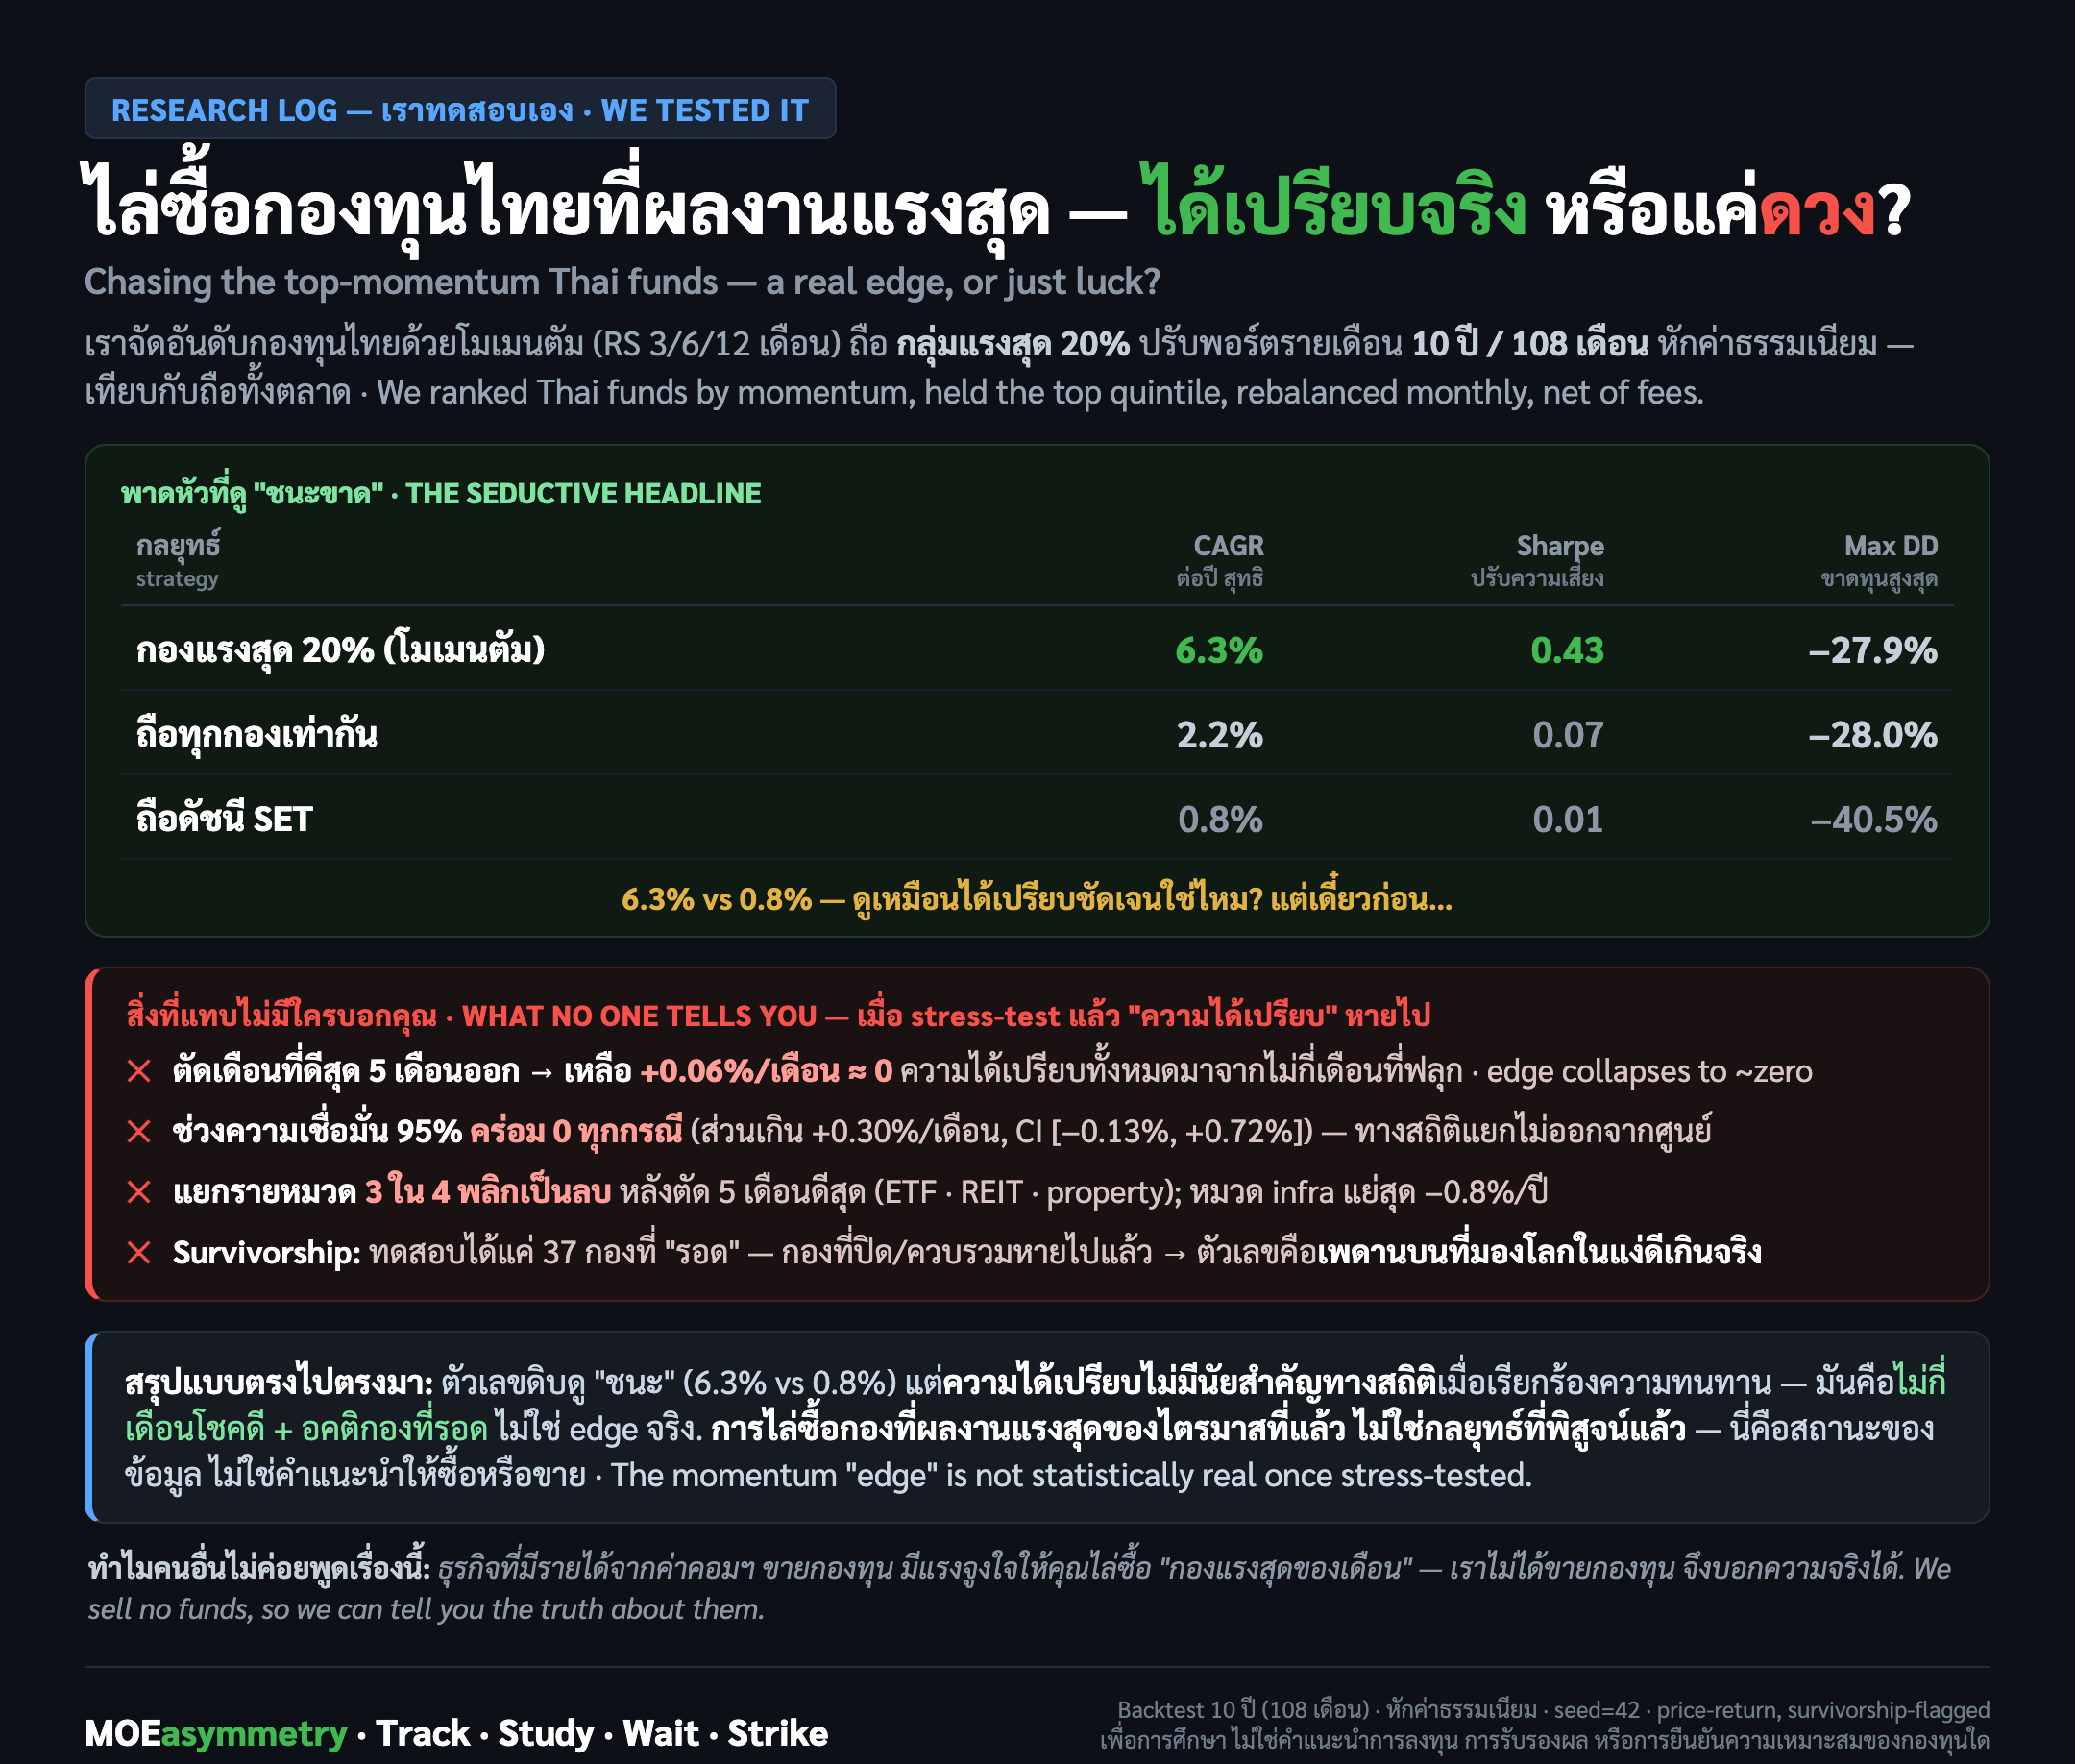
เราจัดอันดับกองทุนไทยด้วยโมเมนตัม (RS 3/6/12 เดือน) ถือกลุ่มแรงสุด 20% ปรับพอร์ตทุกเดือน ย้อนหลัง 10 ปี (108 เดือน) หักค่าธรรมเนียม พาดหัวดูเหมือนชนะขาด: 6.3%/ปี เทียบดัชนี SET ที่ 0.8%/ปี แต่พอ stress-test: (1) ตัด 5 เดือนที่ดีที่สุดออก → เหลือ +0.06%/เดือน ≈ 0 (2) ช่วงความเชื่อมั่น 95% คร่อมศูนย์ทุกกรณี (3) แยกรายหมวด 3 ใน 4 พลิกเป็นลบ (4) ทดสอบได้แค่กองที่ "รอด" เท่านั้น — ตัวเลขมองโลกในแง่ดีเกินจริง (survivorship bias) สรุป: การไล่ซื้อกองที่แรงสุดของไตรมาสที่แล้ว ไม่ใช่กลยุทธ์ที่พิสูจน์แล้ว — มันคือไม่กี่เดือนโชคดี ไม่ใช่ edge ที่มีนัยสำคัญทางสถิติ We ranked Thai funds by momentum (3/6/12M RS), held the top quintile, rebalanced monthly, 10-year backtest (108 months), net of fees. The headline looks like a clean win: 6.3%/yr vs the SET index's 0.8%/yr. But under stress-testing: (1) drop the best 5 months → collapses to +0.06%/mo ≈ zero (2) the 95% confidence interval straddles zero in every case (3) split by category, 3 of 4 flip negative (4) the test only includes funds that "survived" — the numbers are an optimistic upper bound (survivorship bias). Verdict: chasing last quarter's top-performing fund is not a proven strategy — it's a handful of lucky months, not a statistically real edge.