⚠️ Educational research and a personal trading journal — not investment advice. การศึกษาเท่านั้น ไม่ใช่คำแนะนำการลงทุน. The author does not provide licensed advisory services. A study of a past chart, not a recommendation.
Finding the entry is the easy part. The hard part — the part that separates a good year from a great one — is what you do after you're right.
Most traders cut winners too soon. They take a quick 10% and watch the stock triple. Then they hold losers too long, hoping. It's backwards. The whole math of breakout trading depends on doing the opposite: cut losers fast, and let the rare big winner run as far as it will.
Let me show you how that looks in practice. MRVL, a US semiconductor, early-to-mid 2026. It broke out near 98 and ran to 316 — more than tripling in about ten weeks. Here's exactly how you'd hold something like that without either bailing early or giving it all back.
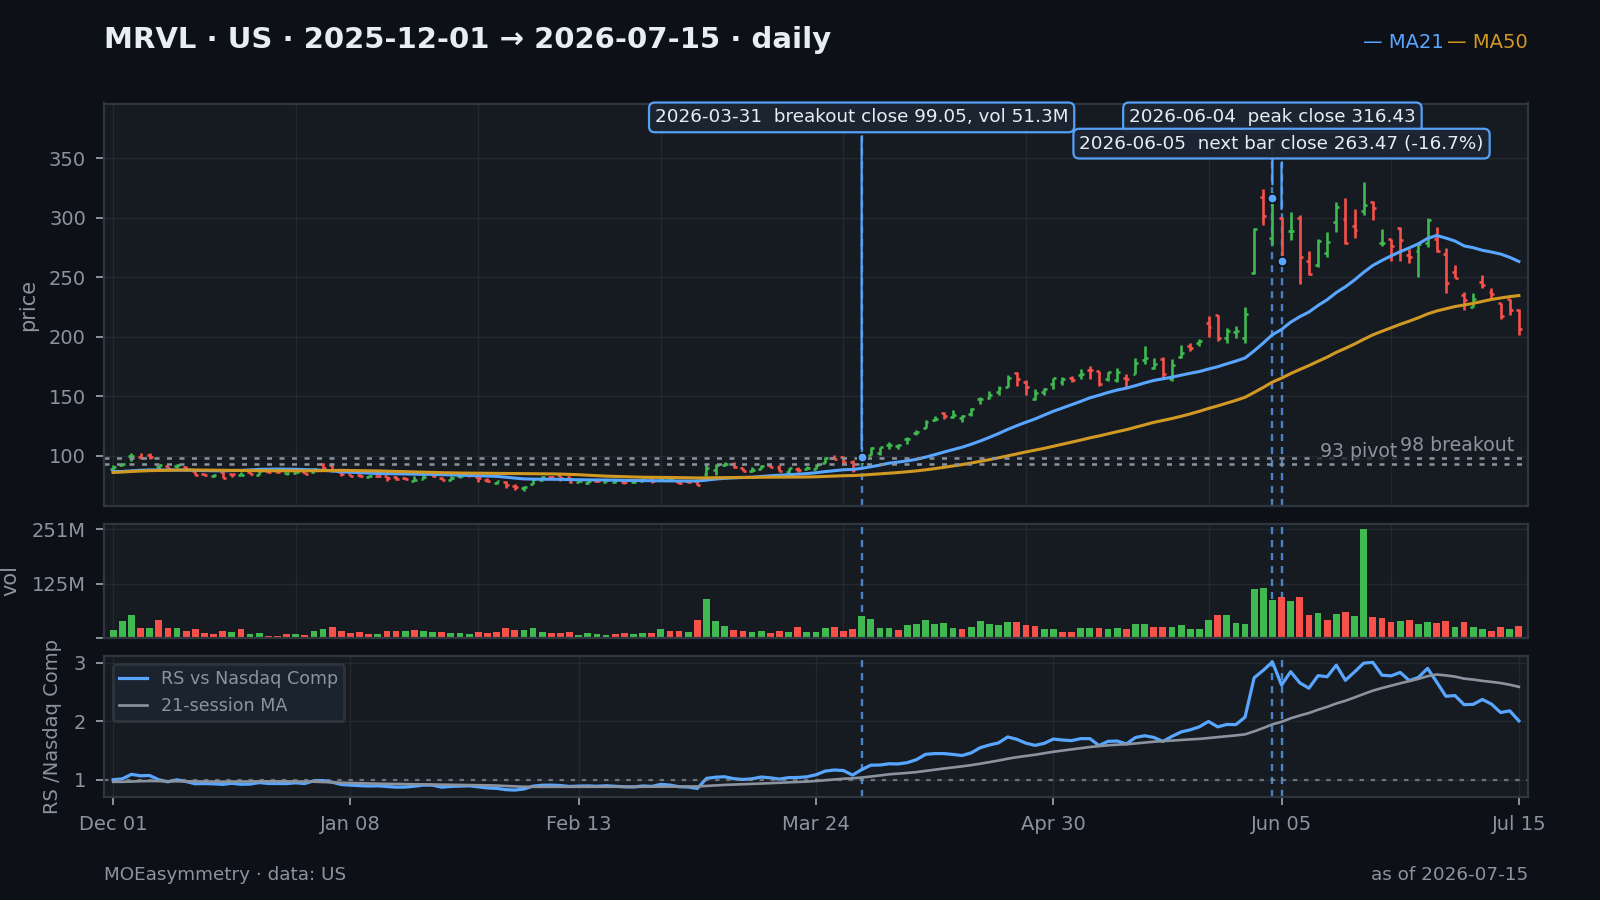
The breakout (briefly) MRVL built a long, clean base — a cup roughly 16 weeks long, the cup low dipping below the 200-day average and then reclaiming it. Pivot near 93, breakout at 98 on a volume pop. (A long base, note — in the US, the longest clean bases tend to produce the biggest moves. That's not true everywhere, but it's true there.)
You're in near 98, stop at the last higher-low. Now the real work begins.
The hold: ride the 21-day average Here's the single most useful tool for holding a winner: the 21-day exponential moving average.
A genuine market leader, in a powerful move, rides up along its 21-day average. It doesn't go straight up — it pulls back, touches or nears the 21-day, and pushes on. As long as it keeps doing that, you keep holding. The 21-day is your trailing handrail.
MRVL rode its 21-day average from 98 to 316 and broke below it cleanly only once the entire way up — a single shakeout day that immediately recovered. If you'd held on that handrail, you'd have stayed in the whole move. Every urge to "take profits at +30%" was answered by the same rule: is it still above the 21-day? Then hold.
This is how you let a winner run without guessing at a target. You don't predict where it stops. You let the stock tell you, by losing its handrail.
Taking some off: the 2R partial Holding the entire position the whole way takes nerves most people don't have — and one gap-down can erase a lot. So I take a piece off early to make the hold easier: - At 2R (twice my initial risk), I sell about half. - I move the stop on the rest to breakeven.
Now the trade is "free" — worst case, the remainder stops at breakeven and I've already locked a profit on the half. That psychological safety is what lets me hold the rest through the volatility to 316. Partial profit isn't about the money; it's about making the hold survivable.
When to sell: the exhaustion wall The 21-day handrail will eventually break, and that's one valid exit. But there's a second, sharper signal for parabolic movers — and MRVL showed it almost to the cent.
When a stock stretches ~100% above its 50-day average, it's exhausted. That's the climax — everyone who was going to buy has bought. MRVL ran to +99.95% above its 50-day average and reversed −17% the next day. It hit the wall and bounced off it.
Two practical notes on using this: 1. Compute it without cheating the future. The sell level for tomorrow is 2× today's 50-day average — a number you know before the bar opens, so you can set a resting order. 2. Set the take-profit just below the wall (~90% extended), because price tends to top a hair under 100% and roll over. A limit set exactly at 100% won't fill. On MRVL, selling ~90%-extended gets you out near the top; waiting for the 21-day to break holds you into the giveback.
Honest caveat: selling into the climax caps some winners that would run further — it's a giveback-avoider, not a return-maximizer. Whether you use it is a question of temperament. But the level — 100% over the 50-day — is a real exhaustion zone worth respecting.
The discipline, distilled > Hold while it rides the 21-day. Take a piece at 2R and move the rest to breakeven so the hold is survivable. Trail the remainder under the 21-day. Respect the ~100%-over-50-day wall as exhaustion.
That's how a +108% — or a +220% — winner gets held, not cut at +20%. The entry made you right. The hold makes you paid.
Track. Study. Wait. Strike.
Educational case study of a past chart, not advice. The author does not provide licensed advisory services. — MOEasymmetry