A few days ago someone asked me where SET actually sits right now in its Elliott Wave cycle.
I'll say this upfront: everything else on this page has been backtested first. This one hasn't — it's a purely subjective technical read, not a signal from any system we actually trade on. Worth being straight about that before going further.
A rule my Elliott Wave teacher gave me
One thing stuck with me from the person who taught me this method:
"Impulse waves count clean — you'll see a clear 5. Corrective waves are messy, and they're genuinely hard to count at all."
So instead of just asserting a wave count, I tested that rule against real SET price data. Not a guess.
What the data actually shows
Counting from the June 23, 2025 low (1,062.78), price traces a 5-wave impulse that's genuinely clean — it satisfies all three of Elliott's cardinal rules: Wave 2 never retraced below Wave 1's start, Wave 3 isn't the shortest of the three impulse waves, and Wave 4 (1,382.97) never overlapped Wave 1's territory (which topped at 1,323.52).
Then I went back and checked the big decline that came before this rally — the 2022–2025 drop from 1,713 down to 1,063. That one fails the cardinal rules: its Wave-4-equivalent bounce overlapped its Wave-1-equivalent zone. By the teacher's own diagnostic, that decline reads as messy — likely corrective, not a clean impulse.
A messy prior decline paired with a clean current rally is itself a piece of evidence — not proof — leaning toward the bullish read below.
The chart and the decision levels
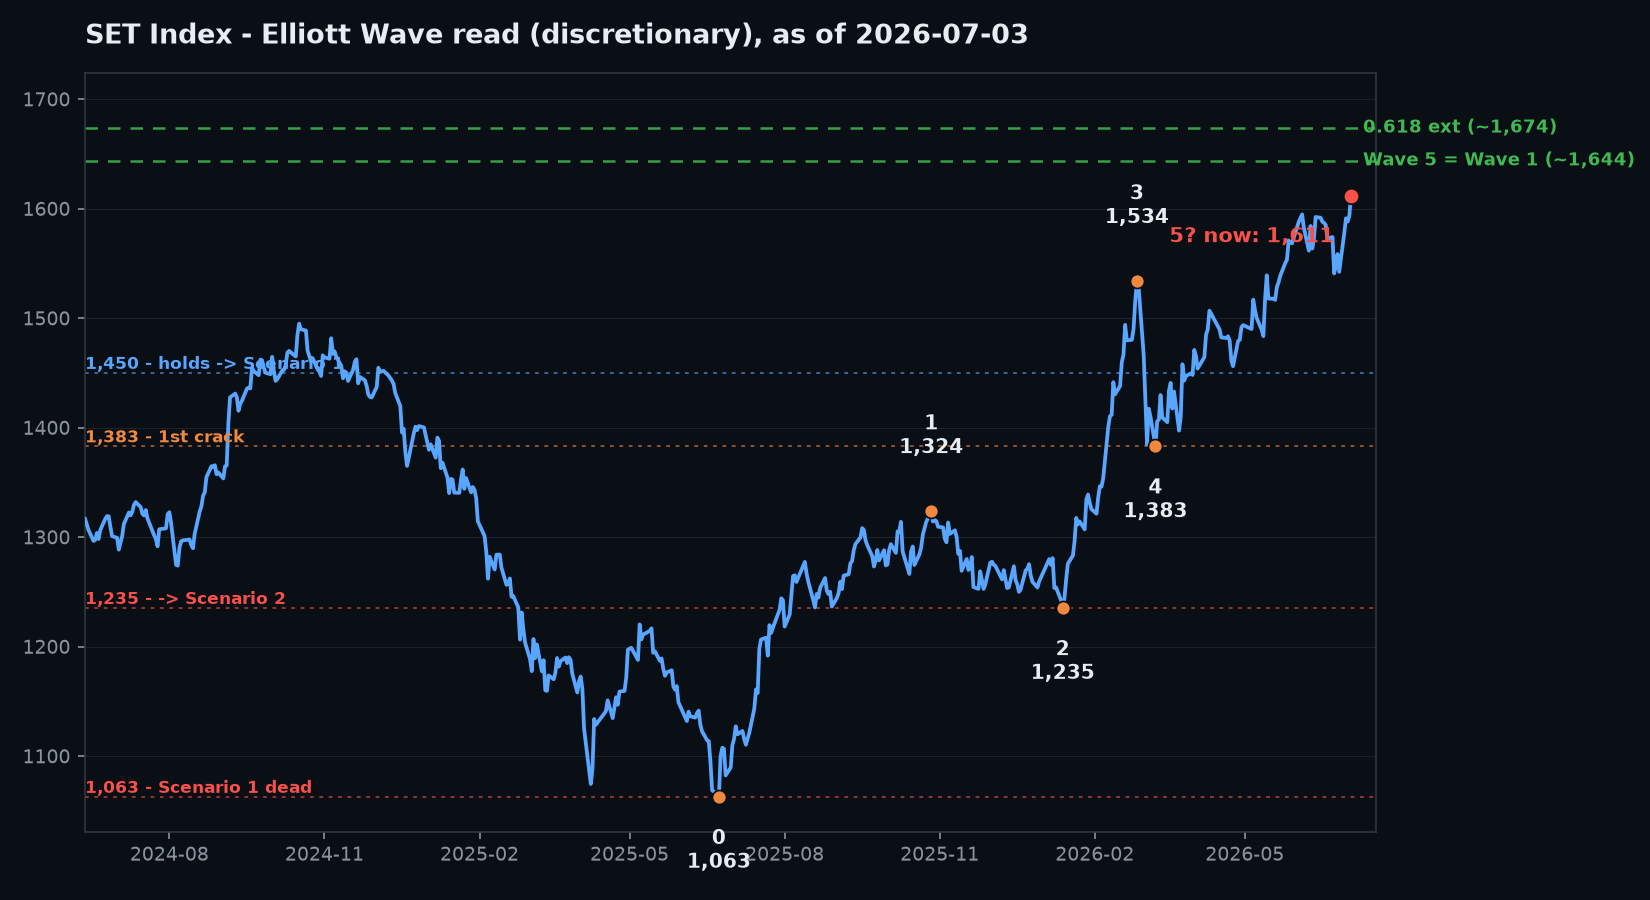
Two scenarios, and the exact levels that decide between them
Scenario 1 — a genuine new cycle. The current Wave 5 (running since the March 2026 low of 1,382.97) tops out in the 1,644–1,674 zone, then pulls back but holds above roughly 1,450 — a shallow, healthy correction. That confirms the new uptrend and further gains are likely over the following quarters.
Scenario 2 — this was only a bounce. Tops in that same 1,644–1,674 zone, but instead of holding, reverses hard. The larger 2022–2025 downtrend was never actually finished, and price eventually threatens the old lows again.
| SET level | What it means |
|---|---|
| 1,644 – 1,674 | Decision zone — both scenarios expect resistance here. How price behaves after this is the real signal, not whether it gets there. |
| Holds above ~1,450 | Scenario 1 confirmed — healthy pullback, new cycle intact. |
| 1,383 – 1,450 | Gray zone — deeper pullback, still technically alive, needs to show a turn. |
| Closes below 1,382.97 | First crack — Scenario 1 in real doubt. |
| Breaks below 1,235.30 | Scenario 2 becomes the higher-probability read. |
| Breaks below 1,062.78 | Scenario 1 is dead. Scenario 2 fully confirmed. |
The honest caveat
Elliott Wave counting is inherently subjective — a different analyst could draw the Wave-2/4 boundaries differently, and the "messy prior decline" read used a blunt swing-detection filter, not a rigorous multi-degree count. Treat this as one input to weigh, alongside the actual distribution-day count and RS data — never a standalone signal.
⚠️ This article is for educational and informational purposes only and does not constitute investment advice. I may hold, or have held, positions in the stocks or indices discussed here. All opinions are my own and are not a recommendation to buy or sell. Please do your own research and consult a licensed financial advisor before making any investment decision.